Spreadsheet to KPI dashboard
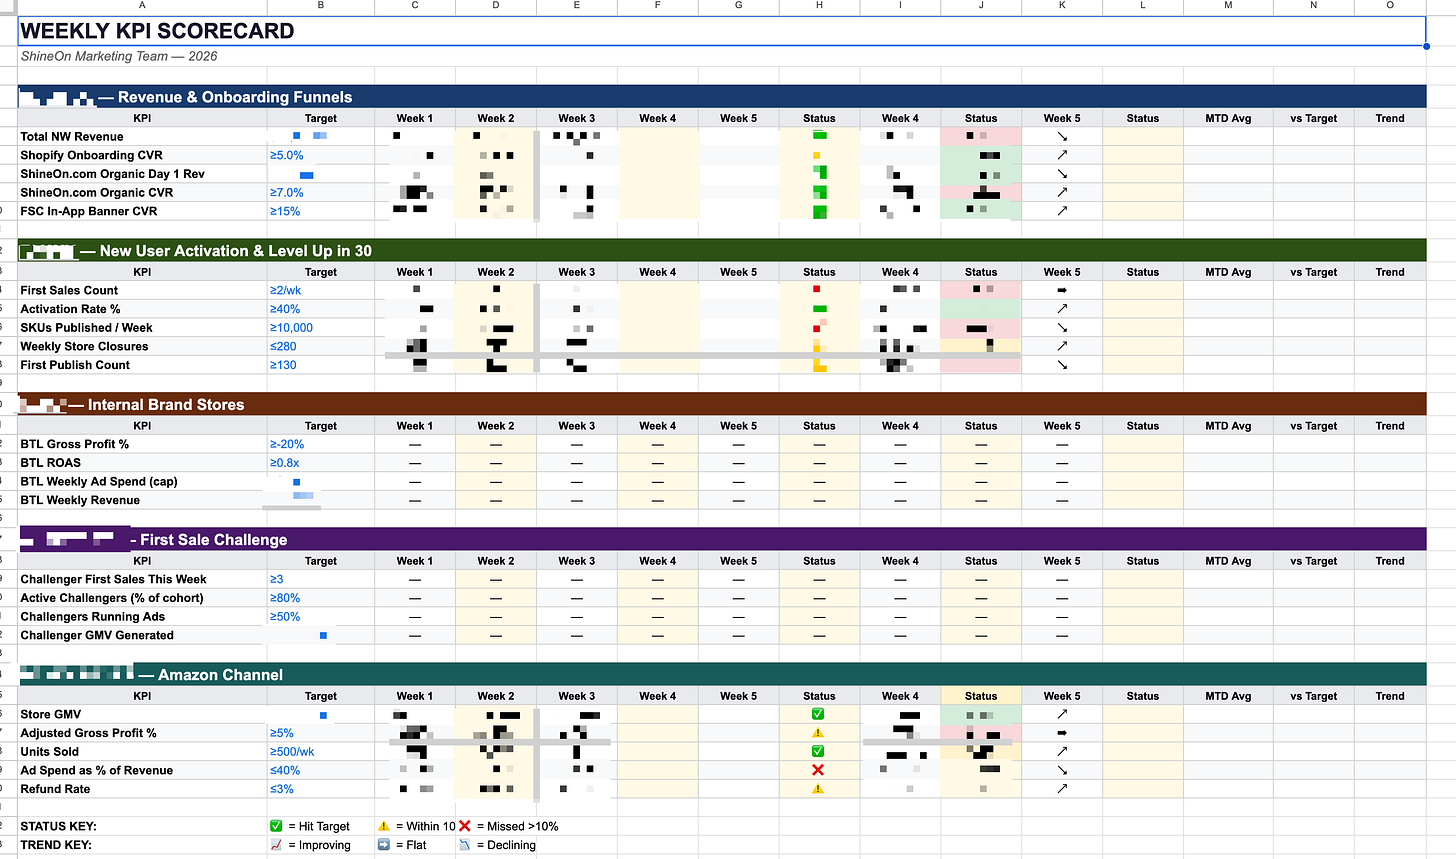
Claude Cowork read a 12-tab marketing tracker, picked key metrics, then built a color-coded KPI dashboard tab inside the live Google Sheet.
The author got a one-screen dashboard in about 20 minutes, work they estimate would have taken 4 to 6 hours by hand.
Overview
How it was set up
Claude Desktop with the Cowork tab on a paid plan. The sheet was uploaded as an XLS file, then Cowork got browser access to edit the live Google Sheet.
Worth knowing
The time saved is the author's own estimate. Cowork needed browser access to the live sheet.
A prompt to start from
Build me a KPI dashboard from this spreadsheet [describe data]. I need everything on one screen, color-coded with targets, weekly trends, and a clear on-track or off-track status. Before you start, show me your plan.Written by Agentic Feats from the source. Not the author's exact prompt.
Sources 1
History
- Source published
- 2026-03-03
- Added to Agentic Feats
- 2026-10-13
- Pick
- No
- Markdown copy
- /c/spreadsheet-to-kpi-dashboard-claude-cowork.md
More in business
27 featsResultOperator returned the requested list of courses, fees and descriptions without further input, saving the author a few minutes of manual admin work.
ResultTwelve demoed workflows, including a KPI model turned into a web app and no-code Jupyter analysis; no time or money figures are given.
ResultThe author turned 47 trip receipts into a categorized Excel expense report in 10 minutes, and built a sourced research brief in 2 minutes.